|
Developing a Long Term Trading System by: Charles J. Tanti B.Sc.(Eng) |
|
|
|
Stress and Pressure of knowing what the market is doing on a Daily Basis. |
|
What is a trading system? A trading system is not the "Holy Grail". Most traders expect too much from a tradingsystem. If a system makes a few losing trades they usually give up just when the market is about to turn in their favor. A good trading system is nothing more than a tool to turn the odds in your favor by employing a proven consistent trading methodology. To be successful, a trader must overcome hope, fear and greed and learn to be patient. The market is always right. A trader needs to pay close attention to the market. He must be able to analyze and interpret the information in the charts correctly and objectively without any emotion. Risk is a part of trading, and it cannot be avoided or eliminated. The successful trader knows this and accepts risk as part of the business of trading. However, he also has the knowledge and confidence that risk can be controlled. To trade a system profitably, one must have the discipline to execute the signals generated. Discipline comes from confidence, and confidence comes from knowledge. Therefore, it is very important to understand how your system works. Confidence and discipline also comes from experience, and therefore a trader must have the patience to observe a trading system in real time to see for himself how and where signals are generated. Every trader knows that in trading TIMING CAN BE EVERYTHING. If you can time your trades perfectly, you will never have to worry about a drawdown. But, as everyone knows, it is not as simple as this. No matter how good you are at technical analysis, most of the time the market is confusing: Is it going: Up, Down, or Sideways. Most traders, especially day traders, look at the market too closely. If you look at the market on a day-to-day basis, you will lose sight of the big picture. In other words, you will get confused about the long-term trend. We all know the saying, "THE TREND IS YOUR FRIEND". There is also another saying, "A FRIEND IN NEED IS A FRIEND INDEED". As a trader, your only "FRIEND" is the "TREND". As long as you trade with the major trend, you should not be too concerned about timing. The "TREND" will always come to your rescue. As long as you stay with it, and as long as you trade in the direction of the major trend.
| ||||
The key components of a Profitable Trading System are:
A long-term trading system, if it is going to be profitable, needs a market that has a tendency to trend for long periods of time. The trend must be evident on daily and weekly charts. Examples are the T-Bonds and T-Notes markets, as well as Currencies. These markets are driven by interest rates, which in turn are driven by the state of the economy. These forces do not turn on a dime. They build momentum and move in the same direction for months or years at a time. 2.Choosing the right price data to Reduce Noise. The data you feed into the system is very important. Daily price data usually has a lot of noise, which in turn can produce a lot of false reversals that can generate false trading signals, which are very hard to filter. On the other hand, weekly data is smoother and makes the major trend more evident. Weekly data will have less noise in it and is much easier to analyse. 3.Choosing a Long-Term indicator to find the Major Trend. Indicators are a mathematical way to measure the state and stength of the market. I have been developing and creating indicators for my systems for the last 30 years. During this time, I have found out that simple works better. For this reason I prefer a long term stochastic. Stochastics work the same way as moving averages, with one big advantage. A stochastic will show the trend of the market and can also indicate when a market has become over bought or over sold. For this reason, the elements of the stochastic can be applied to generate better buy and sell signals, at or near market bottoms and at or near market tops.This is much better than taking the signal from sign changes in the stochastic alone, which usually lags the market and will miss up to $3000 or more from the market turning point. |
|
Building the System: ATS-ZB32 From: 1983 - 2022 - Weekly Price Data. All results are hypothetical. Past performance is no guarantee of future profits. |
|
1: Start - Applying only the stochastic to weekly data. 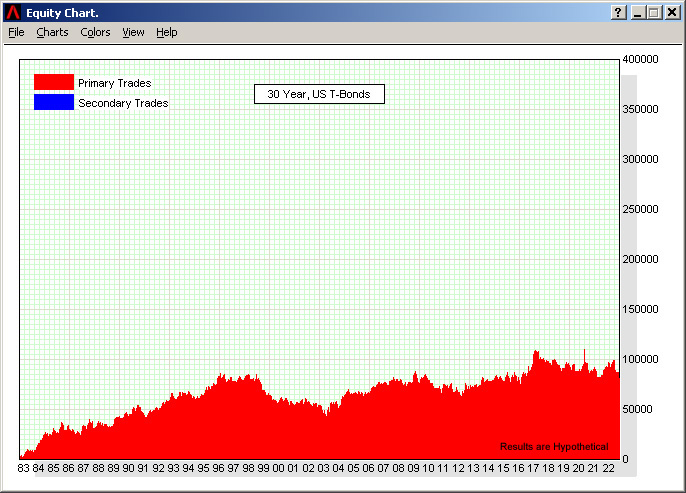
        Trade summary.
      Total No of trades: 260
    No of winning trades: 109
     No of losing trades: 151

           Average Trade: $362
          Average Profit: $4084
            Average Loss: $2323-
           Total Profits: $94,359
             Ave. Profit: $2395/year

No of trades stopped out    5 with a profit.
No of trades stopped out   28 with a loss.

All results are hypothetical
|
|
2: Applying a stochastic with a simple filter. 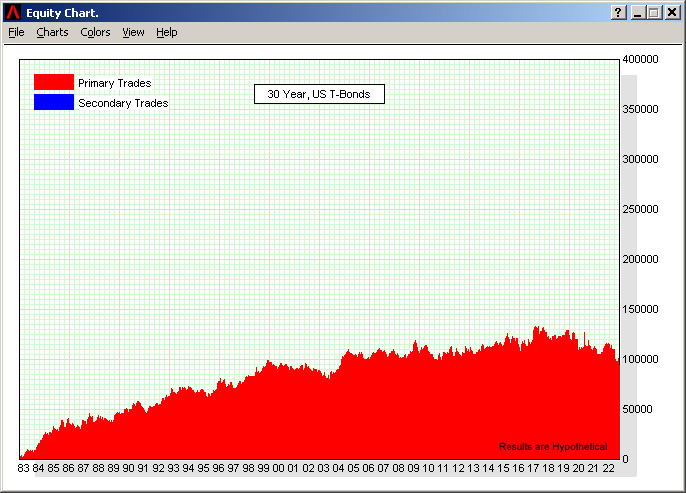
        Trade summary.
      Total No of trades: 212
    No of winning trades: 94
     No of losing trades: 118

           Average Trade: $443
          Average Profit: $4346
            Average Loss: $2682-
           Total Profits: $94,109
             Ave. Profit: $2389/year

No of trades stopped out    4 with a profit.
No of trades stopped out   40 with a loss.

All results are hypothetical
|
|
The performance of a trading system can be vastly improved by applying filtering algorithms to the long term indicator. For example, the stochastic may go from from negative to positive while the system is in a short trade. In this case, this will be a signal that the trend has changed. However, the market may have moved lower. Therefore, even though there was a sign change in the stochastic from "-" to "+", the market actually moved lower. Filtering algorithms can be designed and incorporated into a trading system to improve its performance.

        Trade summary.
      Total No of trades: 82
    No of winning trades: 33
     No of losing trades: 49

           Average Trade: $1860
          Average Profit: $9786
            Average Loss: $3477-
           Total Profits: $152,562
             Ave. Profit: $3872/year

No of trades stopped out   22 with a profit.
No of trades stopped out   31 with a loss.

All results are hypothetical
|
|
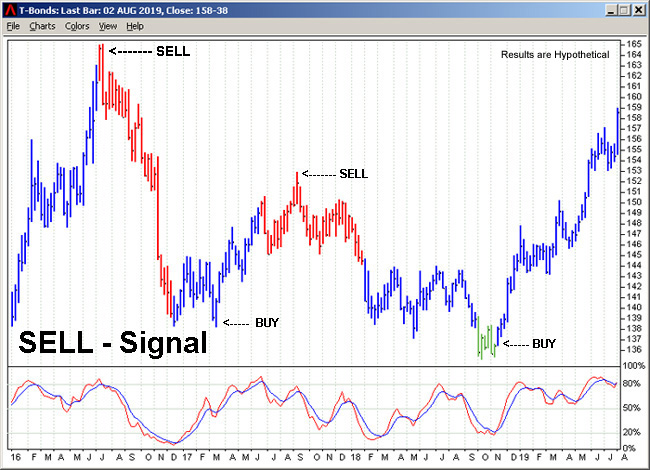
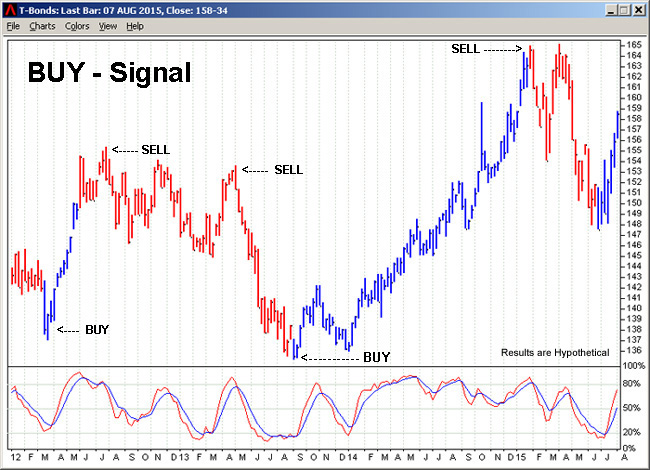
Incorporating Genetic Algorithms A long-term trading system usually gets the signal for the trend from either a moving average or a stochastic. These indicators always lag the market, and unless the market keeps the trend for very long periods of time and there is a substantial price difference between the top of the market and the bottom of the market, it is very difficult for a system to produce good profits. This is because a slow moving average or a long term stochastic normally misses up to $3000 from the top and up to $3000 from the bottom, i.e. $6000 in all. For a system to be truly profitable, it must be able to signal when a market is just going to turn around. Therefore, the system must be able to go short at or near the TOP, and be able to go long at or near the Bottom. This is made possible by creating algorithms that track several indicators at the same time to signal an extremely over bought or an extremely over sold market. Then taking the signal to go SHORT or LONG from several of these indicators at the same time. Since commodity markets cannot go up or down forever, they inevitably become over bought or over sold and turn around. A good algorithm will track a main indicator, but will only generate the buy or sell signal after a signal has been verified by several other built in indicators to produce more reliable and accurate results. Both the "ATS" systems have 15 of these genetic algorithms. These are called the "X" algorithms and the "L" algorithms. There are six "X" algorithms, these generate the "SELL" signals, and there are nine "L" algorithms, these generate the "BUY" signals. |
4: Applying the Algorithms.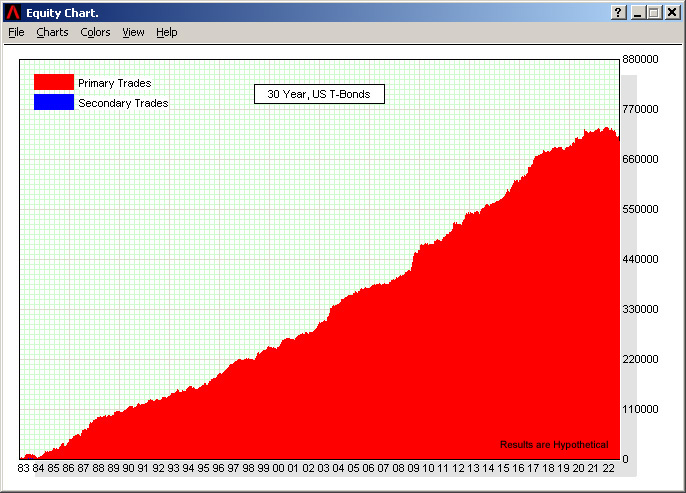
        Trade summary:
      Total No of trades: 93
    No of winning trades: 75
     No of losing trades: 18

           Average Trade: $7528
          Average Profit: $10281
            Average Loss: $3939-
           Total Profits: $700,171
             Ave. Profit: $17,771/year

No of trades stopped out    3 with a profit.
No of trades stopped out    4 with a loss.


All results are hypothetical
| |
The TREND Function turned the Profit of $118,291 from the system |
|
Using functions to keep drawdowns to a minimum, reduce risk, and reduce the number of losing trades.
A good system must have functions to manage a trade after it is started.
|
Comparison: ATS-3200 - ATS-ZB32
The ATS-3200 is no longer available. And TREND makes the ATS-ZB32 almost Perfect. Follow TREND and Never worry about Losing Trades again | ||||||||||||||||||||||||||||||||||||||||||
 |
About the Developer: Charles Tanti B.Sc.(Eng)
I cannot remember a time in my life when I really |
| The ATS systems have been used by customers in 25 countries. |
 |
© Advanced Trading Systems Inc. |